YOU ARE DOWNLOADING
REPORT THIS PDF ⚐<< GO BACK
The Candlestick Trading Bible
Checking download link...
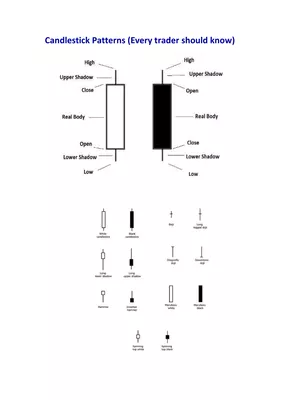 Candlestick Patterns
A candlestick pattern is a movement in prices shown graphically on a candlestick chart that some belief can predict a particular market movement. The recognition of the pattern is subjective and programs that are used for charting have to rely on predefined rules to match the pattern. There are 42...
Candlestick Patterns
A candlestick pattern is a movement in prices shown graphically on a candlestick chart that some belief can predict a particular market movement. The recognition of the pattern is subjective and programs that are used for charting have to rely on predefined rules to match the pattern. There are 42...
 Chart Patterns
A chart pattern is a shape within a price chart that helps to suggest what prices might do next, based on what they have done in the past. Chart patterns are the basis of technical analysis and require a trader to know exactly what they are looking at, as well...
Chart Patterns
A chart pattern is a shape within a price chart that helps to suggest what prices might do next, based on what they have done in the past. Chart patterns are the basis of technical analysis and require a trader to know exactly what they are looking at, as well...
 Intraday Chart Patterns
 PDF in the stock markets are a representation of how the price has moved in the past and how it is moving in the present. Based on this, traders try to predict how the price will move in the future. There are various types of charts like...
Intraday Chart Patterns
Intraday Chart Patterns PDF in the stock markets are a representation of how the price has moved in the past and how it is moving in the present. Based on this, traders try to predict how the price will move in the future. There are various types of charts like...
 Price Action Trading Book
The “Price Action” method of trading refers to the practice of buying and selling securities based on the fluctuations, or “action,” of their prices; typically the data of these price changes is represented in easily-readable candlestick or bar charts, which are the bread and butter of the price action trader....
Price Action Trading Book
The “Price Action” method of trading refers to the practice of buying and selling securities based on the fluctuations, or “action,” of their prices; typically the data of these price changes is represented in easily-readable candlestick or bar charts, which are the bread and butter of the price action trader....