Chart Patterns
Chart Patterns Download Free
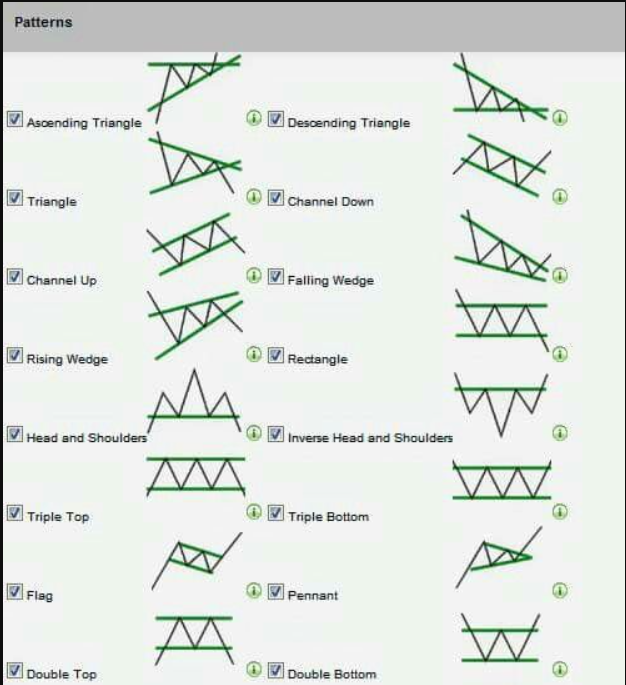
A chart pattern is a shape within a price chart that helps to suggest what prices might do next, based on what they have done in the past. Chart patterns are the basis of technical analysis and require a trader to know exactly what they are looking at, as well as what they are looking for.
A chart pattern or price pattern is a pattern within a chart when prices are graphed. In stock and commodity markets trading, chart pattern studies play a large role during technical analysis. When data is plotted there is usually a pattern that naturally occurs and repeats over a period. Chart patterns are used as either reversal or continuation signals.
Chart Patterns – Types
There are three main types of chart patterns that are used by technical analysts:
- Traditional chart pattern
- Harmonic Patterns
- Candlestick pattern
Chart Patterns HD
You can download the Chart Patterns PDF using the link given below.