Candlestick Patterns
A candlestick pattern is a movement in prices shown graphically on a candlestick chart that some belief can predict a particular market movement. The recognition of the pattern is subjective and programs that are used for charting have to rely on predefined rules to match the pattern. There are 42 recognized patterns that can be split into simple and complex patterns.
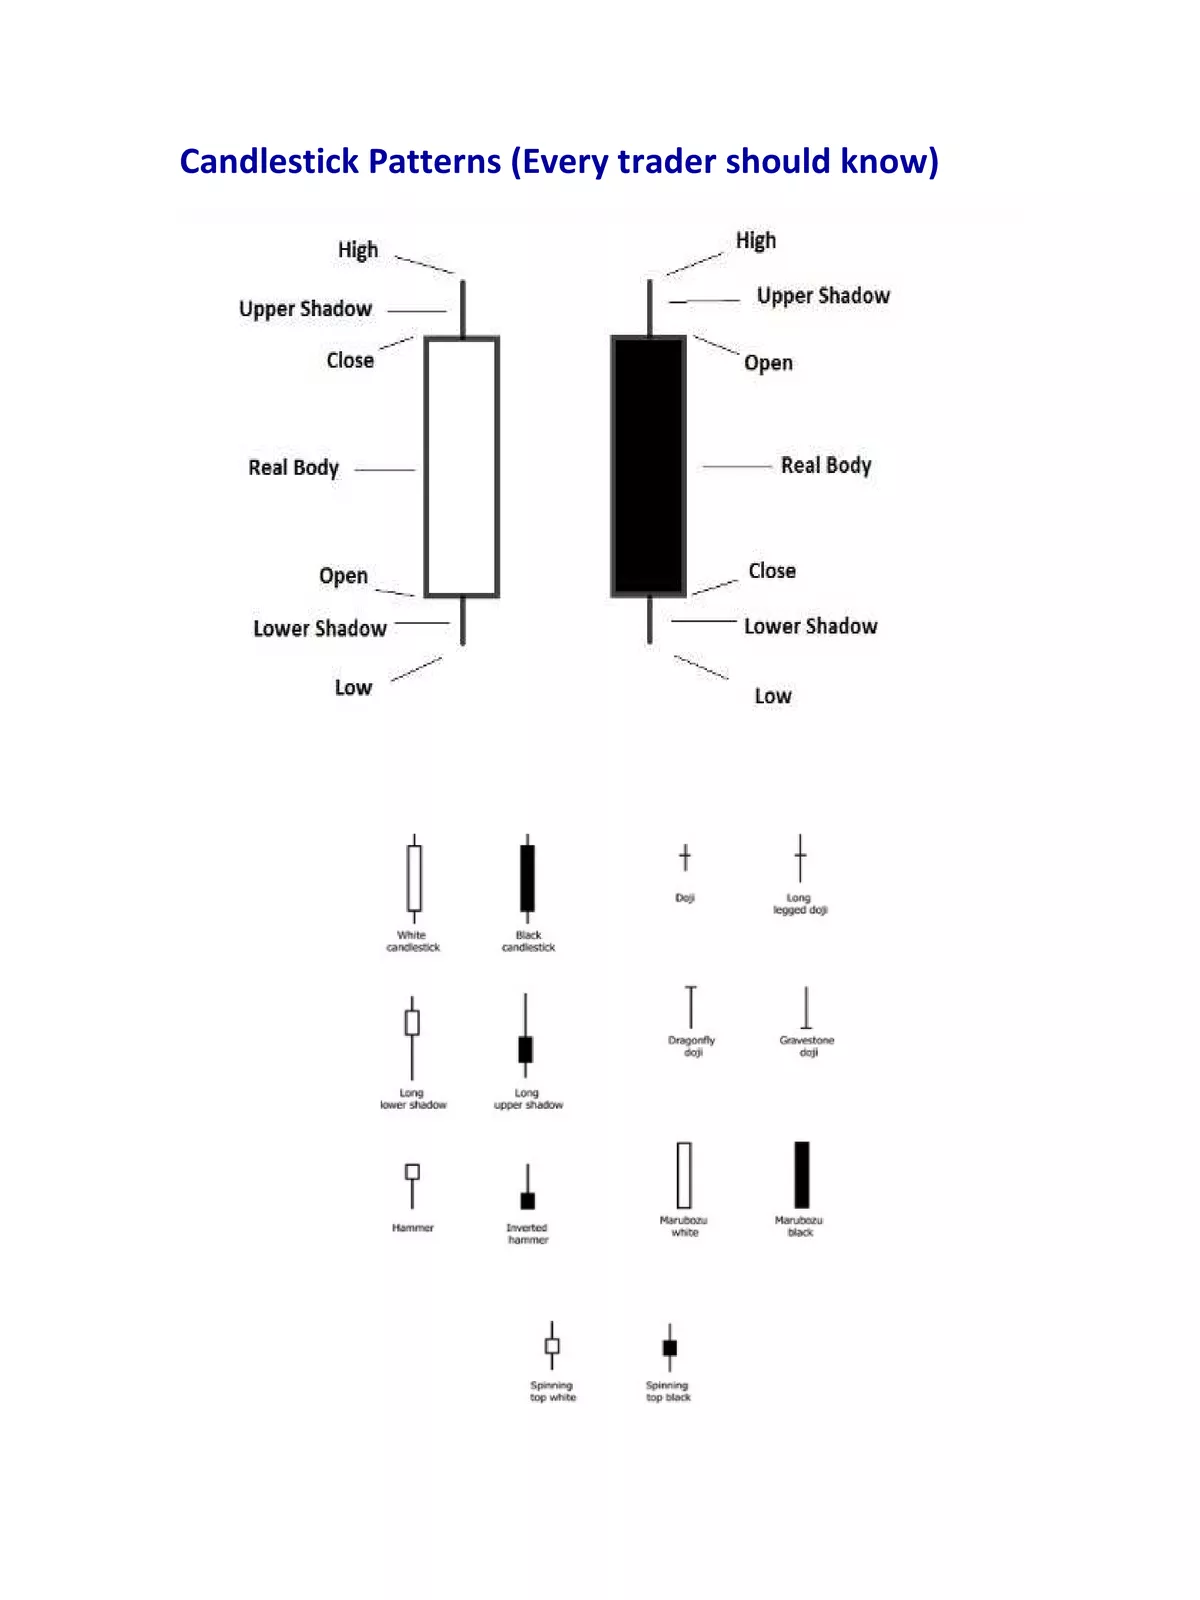
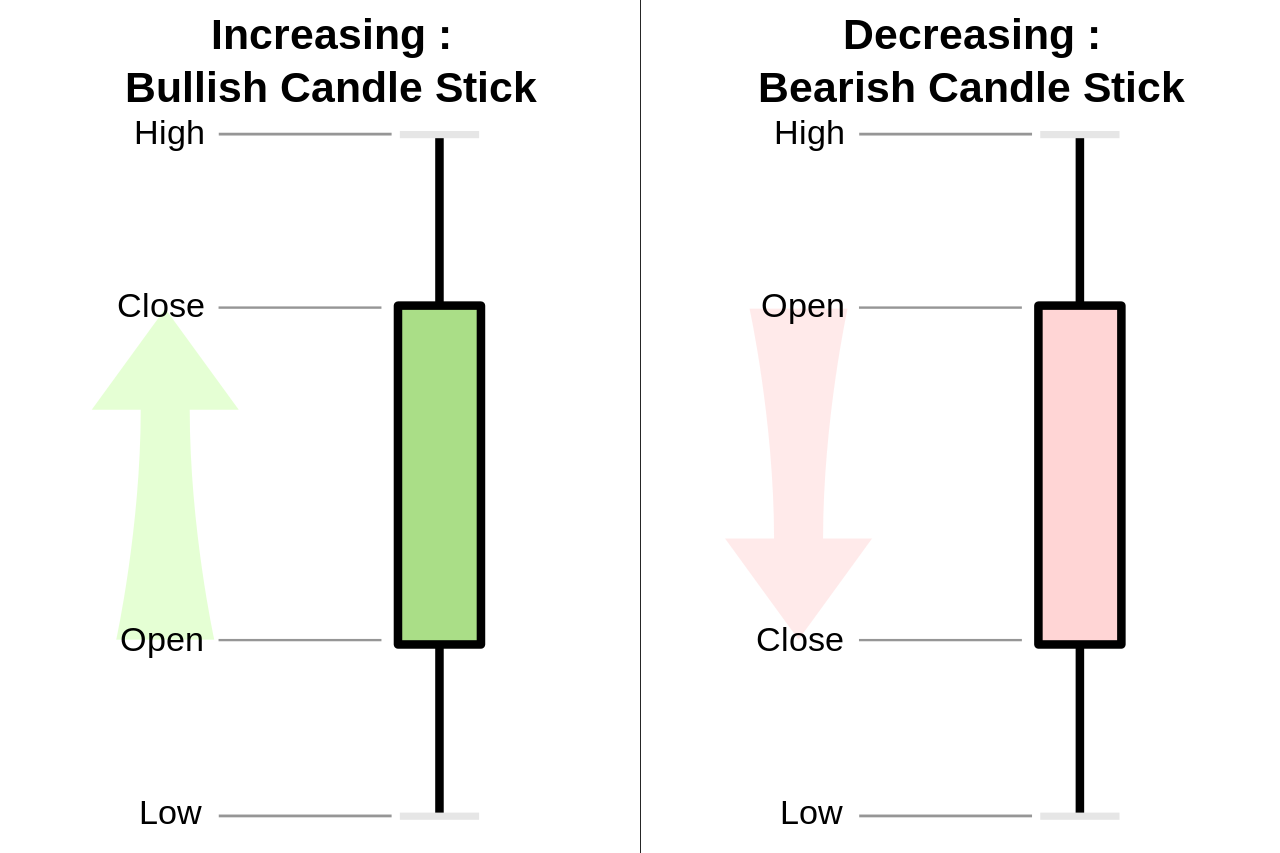
Candlesticks are graphical representations of price movements for a given period of time. They are commonly formed by the opening, high, low, and closing prices of a financial instrument. If the opening price is above the closing price then a filled (normally red or black) candlestick is drawn. If the closing price is above the opening price, then normally a green or hollow candlestick (white with a black outline) is shown. The filled or hollow portion of the candle is known as the body or real body and can be long, normal, or short depending on its proportion to the lines above or below it. The lines above and below, known as shadows, tails, or wicks, represent the high and low price ranges within a specified time period. However, not all candlesticks have shadows.
Candlestick Patterns
Bullish Candlestick Patterns
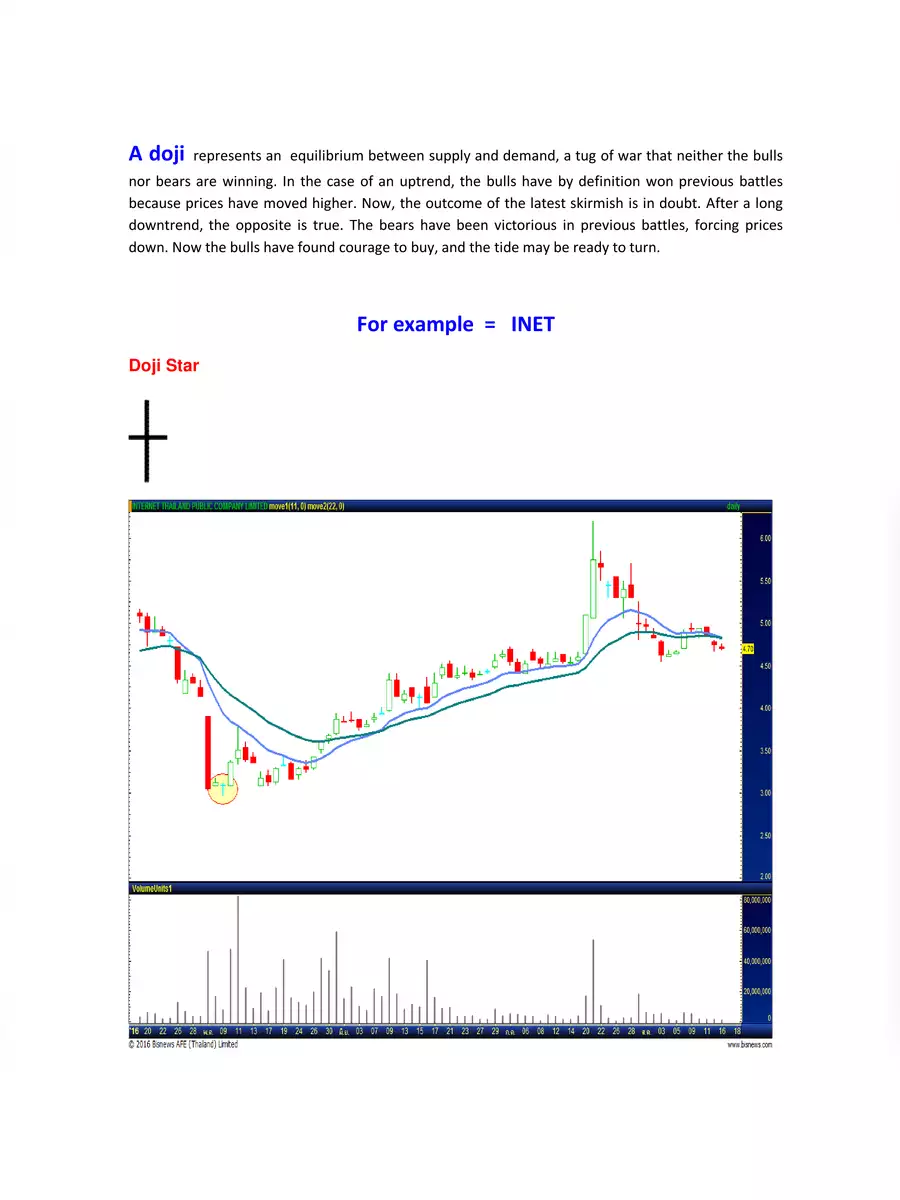
- Morning Doji star:- It is a bullish candlestick pattern. This pattern is similar to the morning star pattern. It also consists of a long bearish candle, it has characteristics of a gap down between different candlesticks. It consists of three bodies, the first stick has a long black body, the second bar opens it open near the lower point and the last one is for the final midpoint of the candlestick pattern.
- Shooting star:- It is a type of candlestick pattern which opens when the security opens in the market trend. It is a bearish trend because the price rises many times during a day but the sellers push the price back to its original place.
- Evening star:-It is a stock price candlestick pattern.it is used for technical analysis when the trend is going for a reversal pattern. It also contains three bodies, a large body, a small body, and a red body candle. It is related to uptrend and downtrend in the market trend. It is used to detect future price lines. This pattern is also a reliable technical trend pattern. This star is opposite the morning star. One of them is bullish and the other one is bearish.
You can download the All Candlestick Patterns PDF using the link given below.