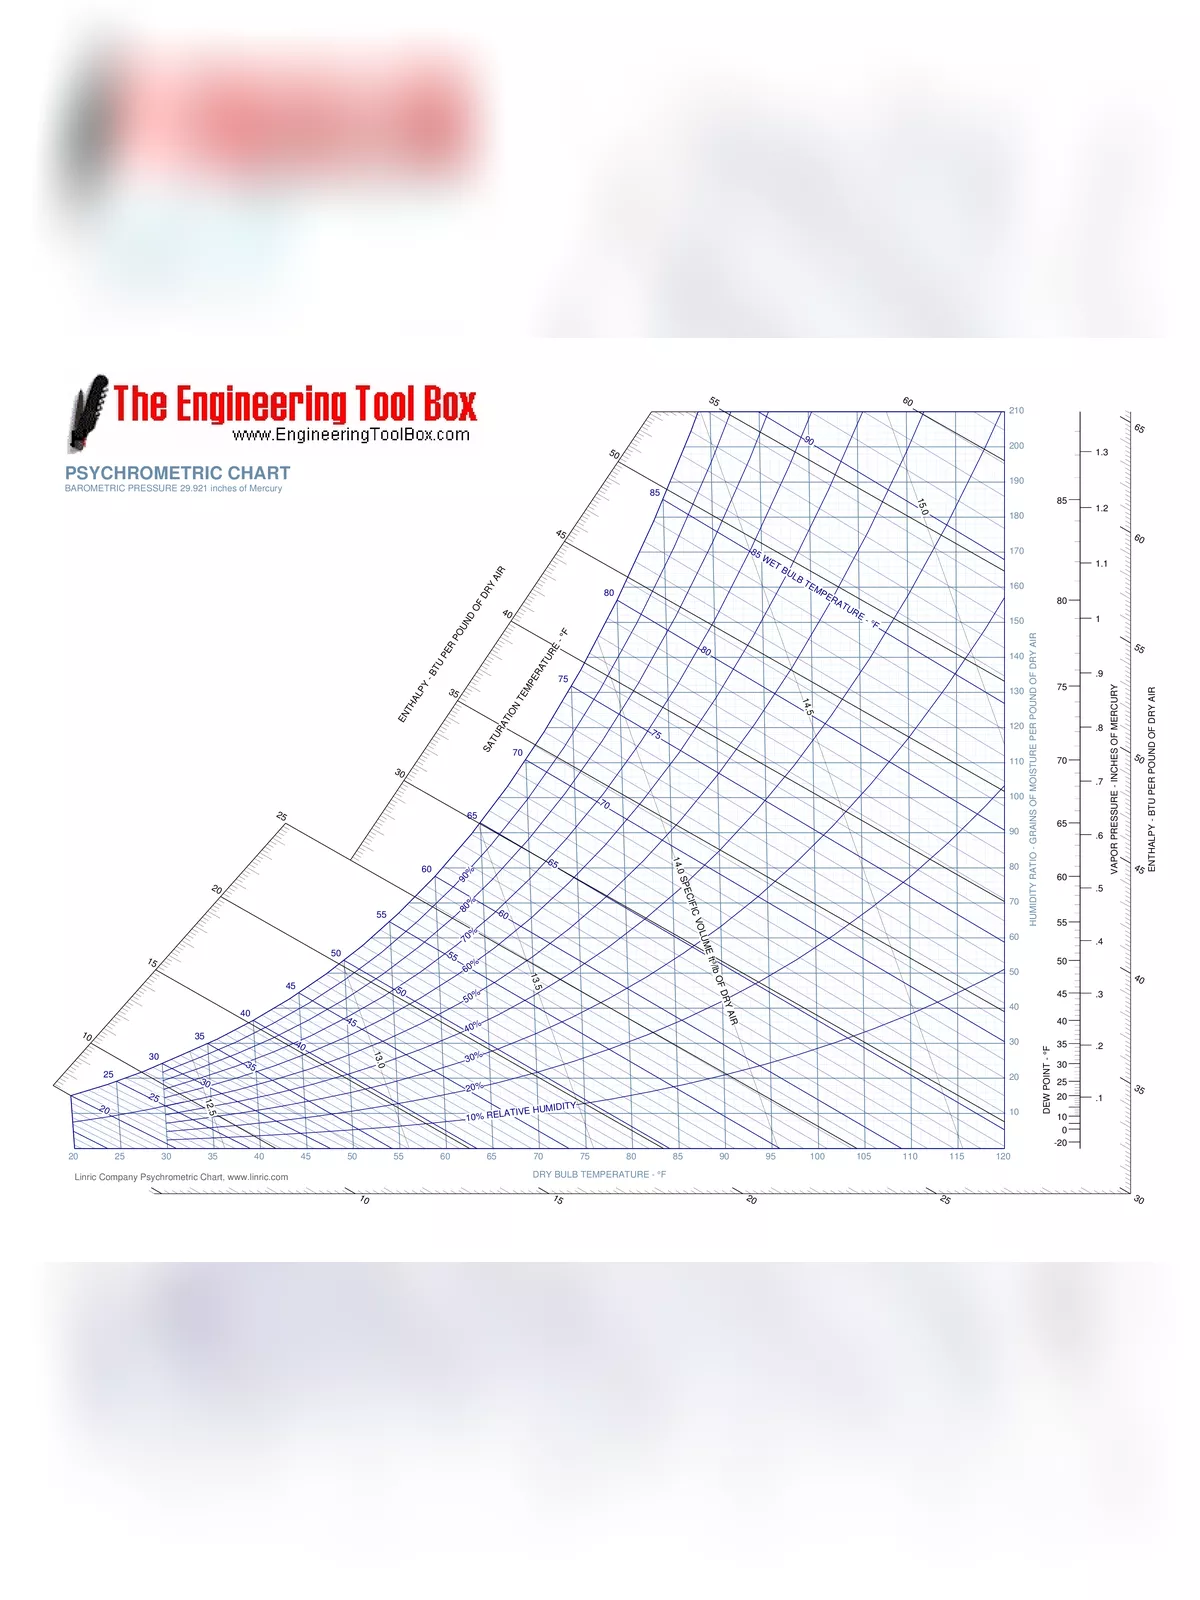
Psychrometric Chart
The psychrometric chart is an industry-standard tool that is used to visualize the interrelationships between dry air, moisture, and energy. If you are responsible for the design or maintenance of any aspect of air-conditioning in buildings, a clear and comfortable understanding of the chart will make your job easier.
A psychrometric chart represents the psychrometric properties of air. With this chart, engineers can better assess psychrometric processes and find practical solutions. The psychrometric chart is a tool for understanding the relationships between the various parameters of supply air and the relative humidity.
PARTS OF A PSYCHROMETRIC CHART
A psychrometric chart basically consists of eight standard parts:
- Temperatures
- Dry Bulb – This is the temperature reading found on a typical thermometer. You can find a psychrometric chart that offers these temperature ranges:
- Low temperatures that range from -20 degrees FDB to 50 degrees FDB
- Normal temperatures that range from 20 degrees FDB to 100 degrees FDB
- High temperatures that range from 60 degrees FDB to 250 degrees FDB
- Wet Bulb – This is a typical thermometer’s standard reading if the sensing bulb is covered with a wet wick or sock and exposed to air flow.
- Dew Point – At this temperature, moisture starts condensing from the air.
- Latent Heat Flow – 60(latent heat of vaporization of water in Btu/lb (970 at sea level))(density of air in lb/ft³)(air flow in ft³/min)(humidity ratio difference in lb water/lb dry air)
- Moisture Content – Also known as the humidity ratio, this is the total weight of water vapor per pound of dry air.
- Relative Humidity – This refers to the percentage of water vapor per pound of dry air in relation to how much the air can hold at its current temperature.
- Vapor Pressure – Vapor pressure is measured in inches of mercury and represents the pressure exerted by water vapor in air.
- Standard Air Dot – This dot marks the measurement for standard air. Standard air is typically 70 degrees Fahrenheit with a relative humidity of 54% and 60 gr/lb of specific humidity.
- Specific Volume & Density – Specific volume is measured in cubic feet per pound. This refers to the amount of space air occupies per pound of weight.
- Enthalpy – This is the measurement of heat energy. Enthalpy is measured by Btu (British thermal unit) per pound of dry air.
- Sensible Heat Ratio – This is the total sensible heat flow divided by the total heat flow.
- Sensible Heat Flow – 60(specific heat of air in Btu/lb ºF (0.24 at 72ºF))(density of air in lb/ft³)(air flow in ft³/min)(| supply air temperature – conditioned room temperature |)
Psychrometric Chart – HOW TO READ
A psychrometric chart can easily be read by following these steps:
Step 1: Locate the dry bulb temperature. This will be measured in degrees Fahrenheit or Celsius and will be along the bottom axis. Also identify the vertical line for each temperature.
Step 2: Locate the humidity ratio, sometimes labeled as a mixing ratio. This will be along the right vertical axis. Humidity ratio units are grains of moisture per pound of dry air or grams of moisture per kilogram of dry air.
Step 3: Located the left-most curved line. This refers to the saturation curve where relative humidity is 100%.
Step 4: Locate the interior curved lines, which represent percentage levels of relativity humidity.
Step 5: Locate the dew point. This is a vertical line on the right side of the chart. These lines traverse the chart as horizontal lines.
Step 6: On the other side of the dew point’s vertical line is the vapor pressure scale. Vapor pressure lines also traverse the chart as horizontal lines.
Step 7: On all outer sides of the chart, you’ll see scales representing enthalpy. With a ruler, you can match the scales across the chart.
Step 8: Find the second set of diagonal lines which identify wet bulb temperature. Though these lines are close to the enthalpy lines, they’re not actually parallel.
You can download the Psychrometric Chart PDF using the link given below.